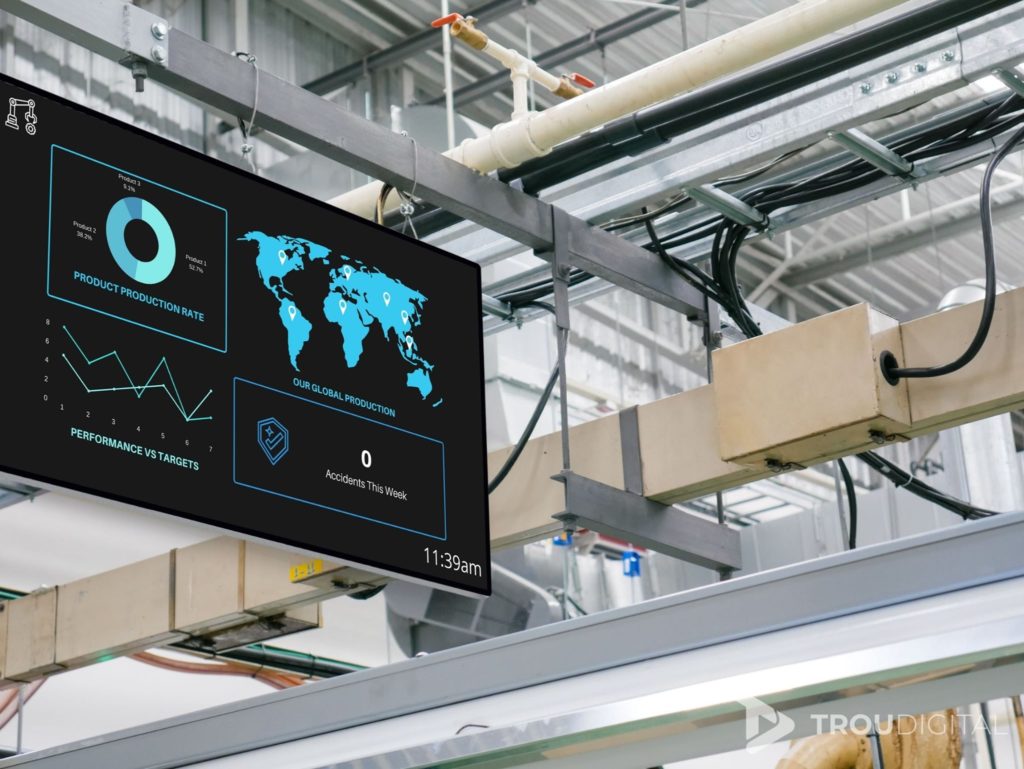
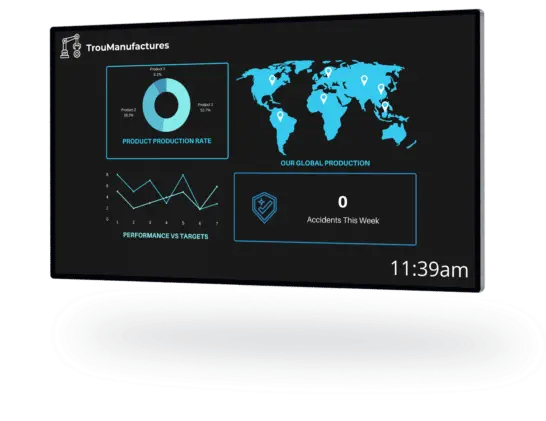
Increasing the visibility of KPIs on Manufacturing screens can help increase performance, operations and efficiency at your facility.
One of the larger issues for employees in the manufacturing industry is access to live performance data. Many factory employees will work with no idea regarding how the factory is performing. Whether that’s regarding daily targets being hit, or what needs to be improved to optimise operations.
When a manufacturing facility is operating at its peak efficiency, all stakeholders can be satisfied. From employees, who are happy working their jobs, to shareholders seeing a rise in profits. Not to mention the customers who will see more orders filled at higher quality.
To ensure the factory can operate at its maximum ability, those working on the front line and those who make key decisions need to be aware of performance. Until recently, this performance data may be reserved for more senior staff members. Or, data was left until a weekly, monthly, and quarterly review. This was no good.
A slow feed of performance data leads to slow decisions. By increasing the availability of data, in real-time employees and managers are able to see how their teams, machines, and factories are performing. From this data, they can make reactive decisions that drive performance and meet targets.
KPIs provide the perfect solution for measuring performance. Screens across your factory help visualise performance and help drive decisions for your workforce.
What is a KPI?
Key performance indicators (KPI) can be described simply as a ‘quantifiable measure of performance over time for a specific objective’.
In the case of a website, this could be the number of visitors over time. The number of visitors is quantifiable and the increase or decrease in numbers can help demonstrate a rise or fall in performance. Therefore, website managers can track if their efforts are leading to more users on their site. A drop in a metric can also highlight an issue. For example, if your website visitors dropped from 10,000 to 10 overnight, there’s likely a serious issue here.
Why are KPIs Important?
It’s critical to measure and track KPIs across all areas of your business. This is because they help indicate how effective your current practices are. They also demonstrate how performance has changed over time, as well as what works (or doesn’t). By analysing KPIs, managers are able to plan and work out what steps need to be taken to optimise operations and maximise KPIs.
Success with KPIs for Manufacturing
For manufacturers, maximising productivity and efficiency are essential. Manufactures want to output the highest possible level of a product, in the shortest time, using the least amount of resources. Beyond this, manufacturers must ensure they meet deadlines, demands and keep relevant stakeholders satisfied. But how do manufacturers know they are doing all of this? In addition, how do they know they are moving in the right direction?
Enter KPIs for manufacturing.
As the saying goes: “What gets measured gets managed”. Essentially what this means is if you measure something, you are able to take the necessary steps to improve the thing you are measuring. For example, if you continuously measure the output of a machine, you can measure what happens to the output when you increase X or Y. If output increases after increasing X you know to increase X more. If output decreases after increasing Y, therefore, you know you need to remove Y. Without measuring you would have no idea what’s affecting output. You would also have no idea if your output was good or bad. By measuring output consistently, you can see how it changes over time and what actions cause it to increase or decrease. Therefore, you can ensure your facility is operating optimally.
Manufacturing specific KPIs to track
Specific KPIs for manufacturing screens:
- Cycle time – actual time spent working on producing an item or providing a service (from first to last task).
- Production volume – total amount your facility can produce over a specific time frame.
- Production cost – cost of production – from raw materials to supplies to general overheads.
- Maintenance cost – cost of upkeep and repair of machines, as well as it tracking effectiveness of machinery too.
- Capacity utilization – output produced with the given resources. Also considering the potential output if capacity was fully used.
- Defect density – the number of defective units produced compared to the total output.
- Delivery time – manufacturing cycle time plus wait time.
PS, this isn’t an exhaustive list – there are literally thousands of KPIs out there to fit a variety of different sectors, needs, and sizes. Pick KPIs that are most critical to the growth and performance of your manufacturing facility and go from there.
Getting Your Team Onboard
Getting your team on board with KPIs is vital. Your team make everything happen and drive results. If your team is informed, then they can quickly act on any issues that arise.
It’s good practice to set some targets around KPIs. For example, if the target for a team of employees was to hit a 95% customer satisfaction rate, they would be more motivated to hit the target. This means they will be on the lookout for drops in the KPI and see what they can do to improve it.
Visualising KPIs, with Screens
PowerBI
Power BI is ‘a collection of software services, apps, and connectors that work together to turn your unrelated sources of data into coherent, visually immersive, and interactive insights‘. You can see how it’s used on one of the images below. In lamens terms, it pulls data from machines and displays it for your staff to see. Above all, this helps visualise complex data into easy-to-read charts.
With digital signage software, you simply connect your PowerBi account, select your chosen dashboard, and apply it to a screen. Dashboards can be fully customised for different teams and areas of the facility. Therefore, employees can glance at the screen and instantly gauge manufacturing performance.

Live Data Widget
With TrouDigital, you can also display live data on your screens through the live data widget. Simply connect your data feed (APIs, CSVs) and customise live charts to visualise your data.
From pie charts and line graphs to progress charts and gauges, visualise data in a way that makes sense to you.
Why are Manufacures Switching to Live Data Dashboards?
- Screens update in real-time (as a result, any issues can be detected sooner – allowing for fast, reactive decision-making).
- Charts updated in seconds.
- Charts can meet full brand specification.
- Multiple dashboards on one visible screen.
- Dashboards can display alerts if KPIs rise or fall above/below a certain amount.
- Engage hard to reach desk-less staff empoyees.
- Used as a multi communication tool.
- Company and safety messaging.
- Key messages can reach factory floor staff in an instant.
- Triggered to display saftey information – in the event of a crisis.

What now?
In conclusion, KPIs for manufacturers are extremely important. Not just in terms of knowing what they are, but measuring them. Then, taking steps to improve them. Finally, ensuring everyone is aware of them.
Increasing the accessibility and awareness of KPIs helps keep everyone moving towards the same goals. Therefore, this keeps your facility moving forwards. Manufacturing KPIs can be visualised on screens across factories.
If you have any questions about using digital signage as a Manufacturing professional, speak to us using the button below.
