Key performance indicators (KPIs) provide valuable business health and performance information. However, a single KPI often doesn’t offer enough insight to meaningfully inform decision-making – particularly when there is limited visibility over progress.
Organisations tend to find more success by leveraging information from several interconnected performance metrics to achieve true data-driven decision-making. While these metrics have historically been tracked on separate spreadsheets and shared periodically (ordinarily on a monthly or quarterly basis), using digital signage software to display KPI dashboards has enabled businesses to achieve real-time visibility over their most important performance data.
Let’s dive deeper into these KPI dashboards to understand more about what they are and why they matter.
Table of Contents
What Is a KPI Dashboard?
Simply put, a KPI dashboard is a centralised, real-time dashboard that displays mission-critical performance data from across various sources – often through interactive graphs and charts.
By transforming key performance indicators into data that can be easily understood, KPI dashboards promote information accessibility and usability. In short, these dashboards bring your data to life.

The Importance of KPIs (and KPI Visibility)
Think of each KPI as a piece of the business performance equation. You can’t solve a complex equation without first identifying all the variables. Likewise, you can’t put KPIs to use unless each data point is visible.
Having visibility over KPIs means businesses can understand if they’re on the right track – and allow them to quickly course correct if not. Tracking KPIs in real-time also allows teams to spot inefficiencies, trends and connections that could be used or improved to enhance business functions.
One of the most important benefits, however, is communication. Ensuring KPI data is visible breaks down organisational silos by creating alignment across the whole business. Communicating KPIs through well-placed digital dashboards enables employees to make better-informed decisions which, in turn, improves results.
What Are the Different Types of KPIs?
KPIs fall into four main types:
- Quantitative – measurable and represented through numbers
- Qualitative – open to human interpretation and not quantifiable
- Lagging – representing past events or performance
- Leading – representing what is to come in the future
There are dozens, if not hundreds, of key performance indicators within these categories. The specific KPIs you track and analyse will vary depending on two main factors: the industry you operate in and your role within the business.
For instance, a member of the C-suite should track KPIs like revenue, operating expenses, payroll, and customer satisfaction. A mid-level manufacturing manager, however, will be more interested in granular metrics such as cycle time and production volume.
Common KPIs include:
- Sales targets
- Lead conversions
- SQLs and MQLs
- Clicks and impressions
- Social engagement
- Revenue
- Net-profit
- Employee and customer satisfaction
- Inquiry numbers
- Response times
- Operating efficiency
KPI Dashboard Examples
When paired with the right software, KPI dashboards are highly customisable, meaning each display can be tailored to its purpose.
That being said, the type of data being tracked tends to fall into one of the following broader categories:
Executive KPI Dashboard
Executive KPI dashboards allow decision-makers to track goals against KPIs over a long period. For instance, a manufacturing executive’s dashboard might track metrics like output, revenue, production capacity, inventory, etc. These are mainly used by senior-level teams, stakeholders and C-suite executives.
Operational KPI Dashboard
Operational KPI dashboards focus on more granular, day-to-day data about a company’s operations and are the most commonly used. Shift managers, department heads, and team leads use these dashboards to provide a quick overview of real-time information.
For example, an accounting department manager at a mid-sized business may use an operational KPI dashboard for several purposes. It could help them track the average invoicing processing time, the number of pending accounts payable and accounts receivable invoices, and the payments received over the last week.

Forecasted KPI Dashboard
Forecasted KPI dashboards, commonly used by C-suite executives and department-level leaders, allow you to track progress toward a clearly defined goal. For instance, suppose that your sales manager wants to find out whether their team is on pace to hit this quarter’s sales volume goals. They would use a forecasted KPI dashboard to make that determination.
Analytics-Focused KPI Dashboard
Teams of data analysts most often use analytics-focused KPI dashboards to get more in-depth insights into specific business challenges. Middle managers also use them to monitor their progress toward higher-level business goals.
For example, imagine a manufacturing facility manager is tasked with cutting materials waste by 5%. An analytics KPI dashboard will help them assess waste metrics, such as rework rate, material usage, and total output.
KPI Best Practices
Before taking advantage of KPI dashboards, you must identify which metrics to track. The first step towards this is clarifying your goals, either as a whole organisation or as a team/department. Once these are in place, choosing the right KPIs and establishing if and how you can measure them becomes much easier.
Effectively setting KPIs also relies on having buy-in from the rest of the team. Targets and KPIs should be discussed to encourage feedback. It may be that the proposed indicators are too ambitious or rely on data that your team can’t currently access. Before setting up any KPIs, it’s also important to measure where the team or company currently is, as this will be the starting point for whatever you choose to track.
Here’s Why Better KPI Dashboards Give You the Edge
Ensure More Valuable Data
Your organisation has amassed an abundance of business performance data. KPI dashboards empower your team to put that information to use. With the right dashboard technology and digital signage software, you can visualise your performance data and use it to drive value for your business.
Engage the Right People
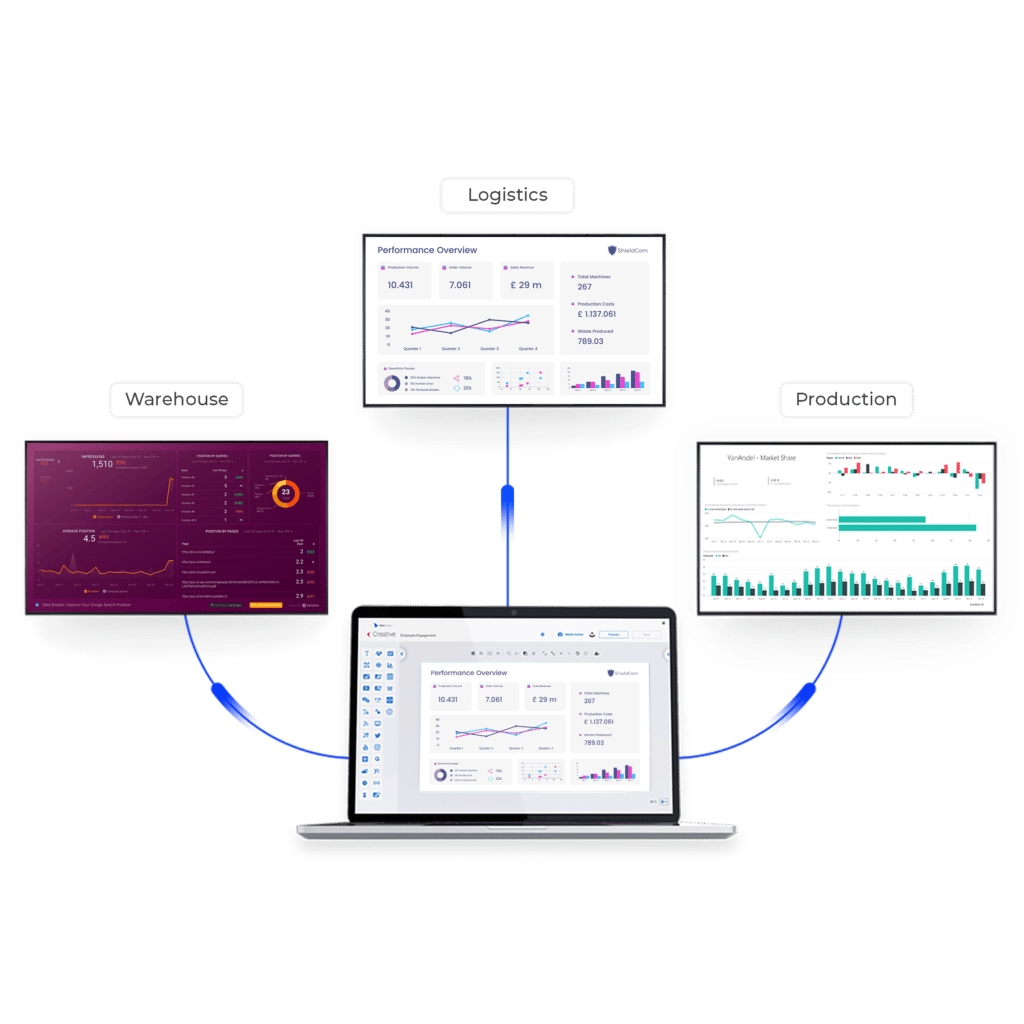
Robust KPI dashboards drive engagement and collaboration across your entire organisation. With the right technology in place, it’s possible to create department-specific TV dashboards so you only serve relevant data to the most appropriate people.
Allows Teams to Measure What Matters
KPI dashboards reveal the “why” behind business outcomes. Users can turn to their custom dashboards to measure relevant performance indicators and track their progress toward growth objectives.
Offers Simple, Consumable Insights
You don’t need to schedule a full-scale presentation to relay business insights. With KPI dashboards, you can access actionable data at a glance and tear down information silos that slow decision-making.

Digital Signage Can Bring KPIs to Life
As mentioned, KPIs have historically been recorded through spreadsheets or stored on different platforms, making communication and data visibility a challenge. Leveraging digital signage technology can help to avoid this.
Companies can now use screens to easily share KPI data in engaging and digestible ways. Strategically positioned TV dashboards throughout corporate offices or manufacturing facilities ensure all teams align with important goals.
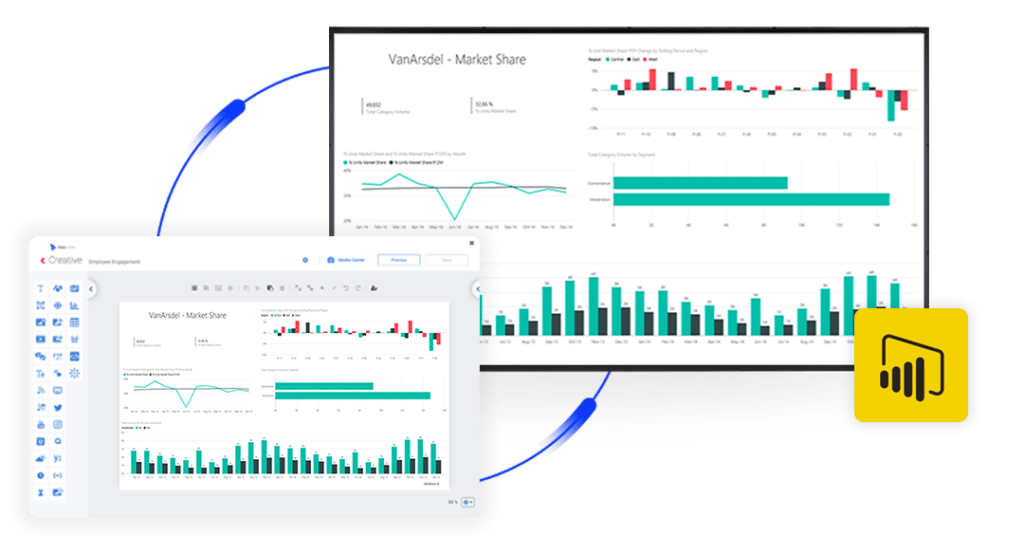
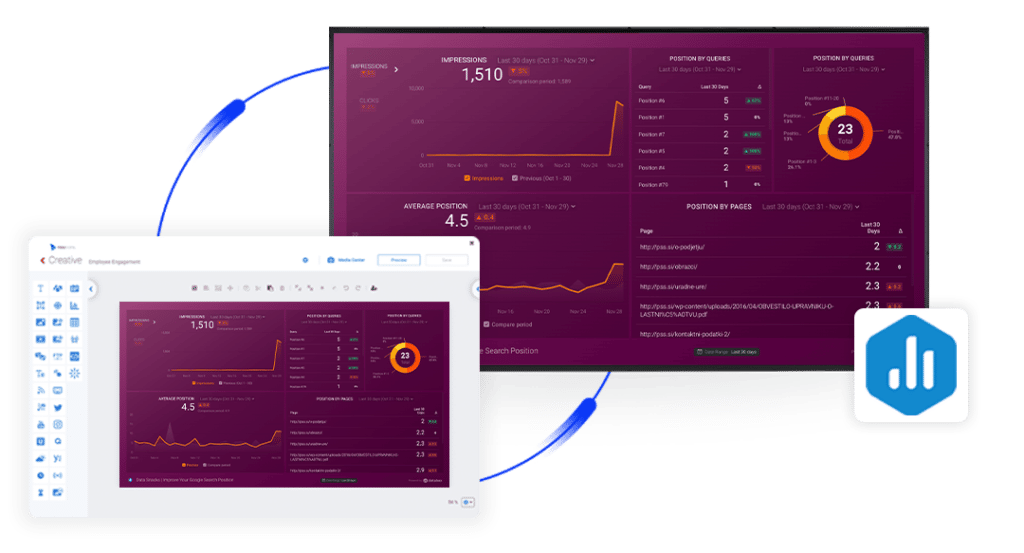
Using digital signage software adds an extra layer of flexibility. With the right solution in place, it’s possible to pull in and centralise data from platforms like Tableau or PowerBI. Users can then create, update and monitor dashboards remotely while displaying the data across a network of screens in real-time. Different dashboards can also be served to the most relevant departments, even if they work within the same building.
Digital signage ultimately allows companies to put the right data at the fingertips of the right people, helping to unite every level of the company around core objectives and thrive as a result.
Contact our team of experts to learn more about creating your KPI dashboards.
