In manufacturing, managing the numerous interconnected processes and analysing vast amounts of data is crucial to ensuring a smooth, effective operation. Managers are juggling overseeing resource procurement, production processes, and the shipment of finished goods, all while keeping track of ever-changing data. Displaying this critical data in a useful way has long been a challenge in this industry. This is where manufacturing dashboards come in useful.
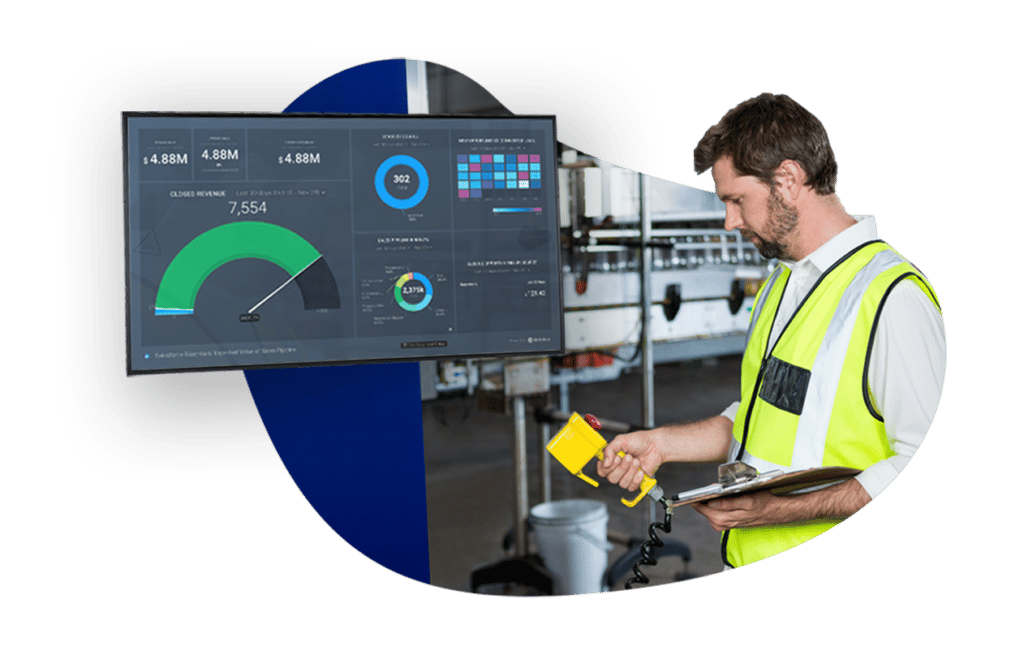
A production dashboard supported by digital signage software has emerged as an indispensable tool for streamlining all aspects of manufacturing process management through continuous monitoring and data visualisation. These real-time displays integrate data from multiple sources, making it easier to monitor performance and identify bottlenecks or areas of improvement. Not only do manufacturing dashboards benefit internal operations, but they also provide valuable insights for partners and suppliers, fostering collaboration and efficiency across the entire supply chain.
In this article, we’ll explore examples of effective manufacturing dashboards, their use cases and benefits. Let’s start by defining what this solution is.
Table of Contents
What Is A Manufacturing Dashboard?
A manufacturing dashboard is a real-time visual dashboard that captures and displays essential production metrics by combining data from various sources such as machinery, sensors, devices, and personnel. These dashboards present the information in an easy-to-understand, user-friendly way through charts, tables, graphs, and other visualisation techniques.
The primary purpose of a manufacturing dashboard is to provide a centralised location for monitoring critical production KPIs. This not only facilitates tracking and improving product quality but is also useful for effectively managing manufacturing expenses.

Production dashboards eliminate the need to manually gather and analyse data, ensuring the necessary information is available whenever and wherever required.
Let’s go on by showcasing several manufacturing dashboard examples, identifying the types of manufacturing data displayed and the potential benefits you can derive from each of them.
Manufacturing Dashboard Use Case Examples
Here are some examples of production dashboards that can help your manufacturing operations.

Top-Level Production Dashboard
A top-level production dashboard offers a comprehensive view of an organisation’s overall production capacity and volumes, enabling crucial KPIs to be monitored and processes to be optimised. By detecting potential inefficiencies and uncovering hidden trends that could negatively impact operations, these dashboards play a vital role in data-driven decision-making within the manufacturing industry.
For instance, understanding overall production volume helps identify discrepancies between different time periods and pinpoint their causes, such as equipment breakdowns, underproduction, or staff overload. In addition, comparing production volume with order quantities allows for evaluating whether the factory can keep up with demand, thus impacting revenue generation.
Manufacturing KPI Dashboard
A manufacturing dashboard can offer high-level executives a comprehensive view of vital manufacturing KPIs, facilitating strategic decision-making. Designed as a KPI scorecard, it can encompass four key pillars: effectiveness, quality and performance, production, and cost and revenue. Regular monitoring of these metrics allows you to optimise your strategy and improve manufacturing performance.
Effectiveness metrics can include a wide range of elements, such as overall equipment effectiveness (OEE), total effective equipment performance (TEEP), overall operations effectiveness (OOE), and capacity utilisation. They help forecast and schedule production processes, ensuring stability and smooth operations. Focusing on production time, scheduled time, operating time, and downtime, the dashboard highlights areas for improvement.
The manufacturing KPI dashboard can also provide quality and performance data and insights into production volume and on-time delivery, enabling comparisons with previous months. Lastly, a cost and revenue section can offer monetary insights, helping executives assess the success of strategic initiatives and identify potential areas for optimisation.
Cost Management Dashboard
In the competitive manufacturing landscape, efficiency, quality, and cost minimisation are vital. A cost management dashboard can provide you with critical metrics related to cost optimisation, allowing for efficient monitoring and decision-making. What metrics can a cost management dashboard display?
In an asset-heavy sector like manufacturing, it is essential to know your assets and their value. A cost management dashboard can go a long way in helping you evaluate your assets by providing you with metrics, such as asset turnover ratio and return on assets. Thus, you gain insights into revenue generation and profit-making capacity relative to assets.
Another important figure to track is maintenance costs, which form a significant portion of manufacturing expenses and should be minimised over time. A real-time display can also indicate the unit cost, or the expenditure required to produce a single item, which should generally decrease as expertise grows and equipment investments decline.
By providing you with all these critical metrics, a cost management dashboard empowers you with valuable insights that you can use to optimise your strategies and gain a competitive edge.
OOE Dashboard
The OOE (Overall Operating Effectiveness) dashboard offers a focused view of this crucial metric, which tracks the availability of production lines from start to finish. It can come as a real-time, daily monitoring tool providing manufacturing managers with an at-a-glance view of machine performance, showcasing metrics such as throughput, OEE, capacity utilisation, first pass yield, and scrap rate. Why are there figures essential for your business?
Throughput measures production volume, while capacity utilisation determines how much of the production capacity is being used. First pass yield (FPY) assesses quality and process reliability, and scrap rate indicates the percentage of failed products. What’s more, an OOE dashboard can provide a comprehensive view of overall machine performance and a detailed breakdown for each machine, allowing you to identify and address inefficiencies in production processes.
How to Create Your Manufacturing Dashboard
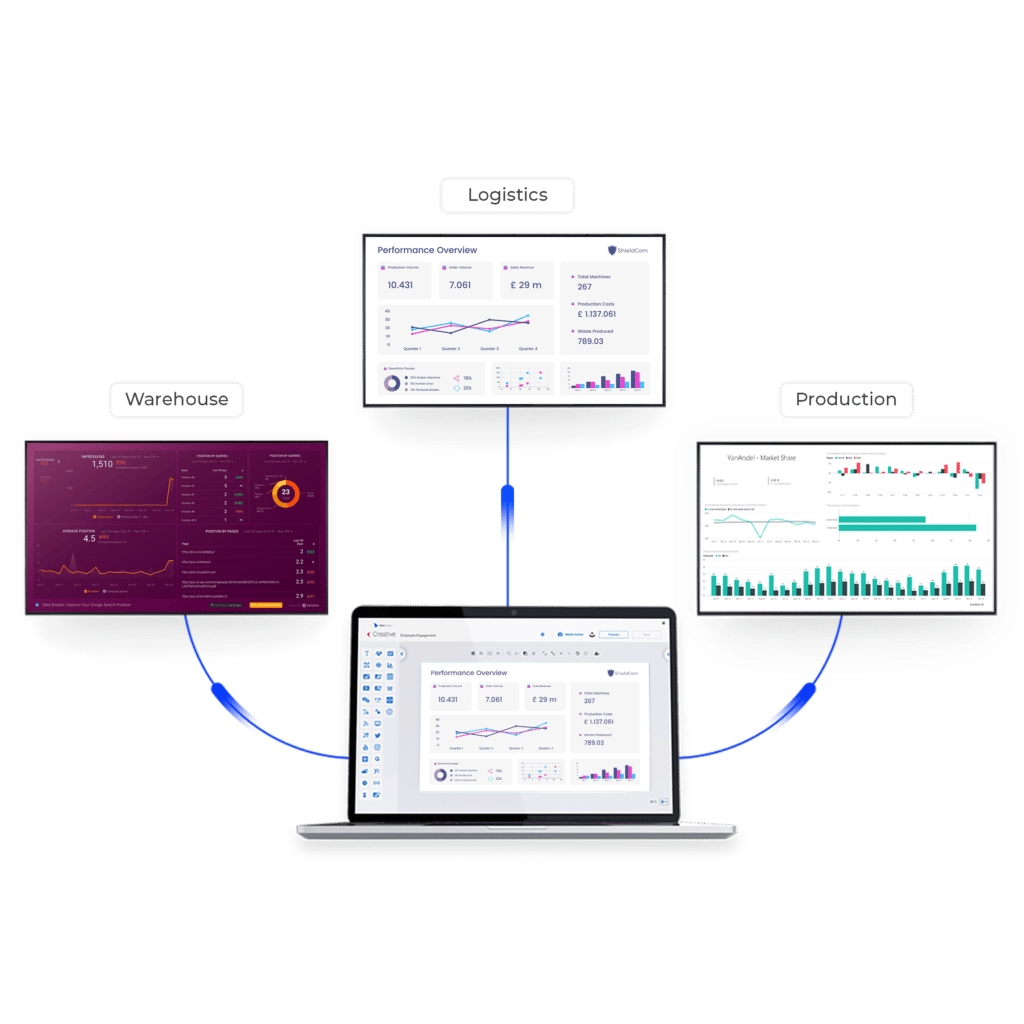
Now that you have gained a better understanding of the valuable insights and benefits a manufacturing dashboard brings, let’s discuss how you can create one using a digital signage solution. Managing your manufacturing dashboard with digital signage software enables you to create, share and update multiple manufacturing dashboards remotely, in real-time.

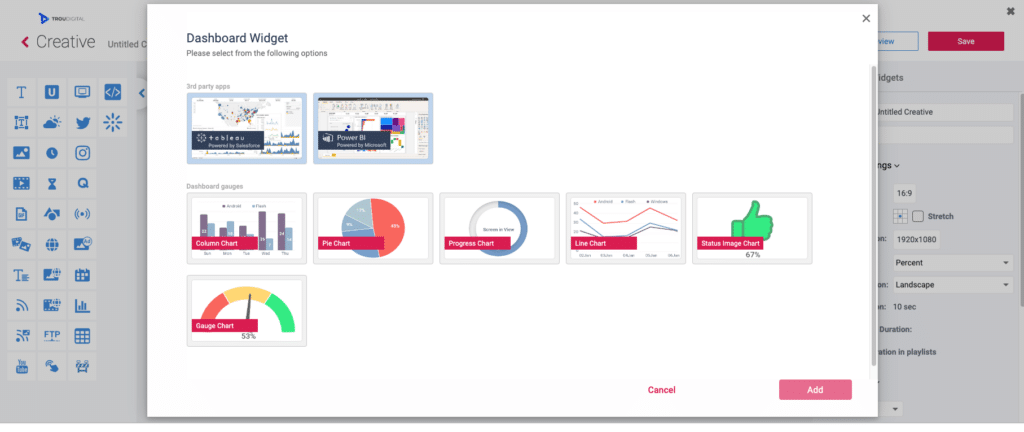
Using digital signage software with a dashboard widget to create live data digital dashboards brings data to life on your screens using progress, column, or pie charts, tables, and gauges. The tool allows for easy selection of the chart style and re-sizing of your dashboard.

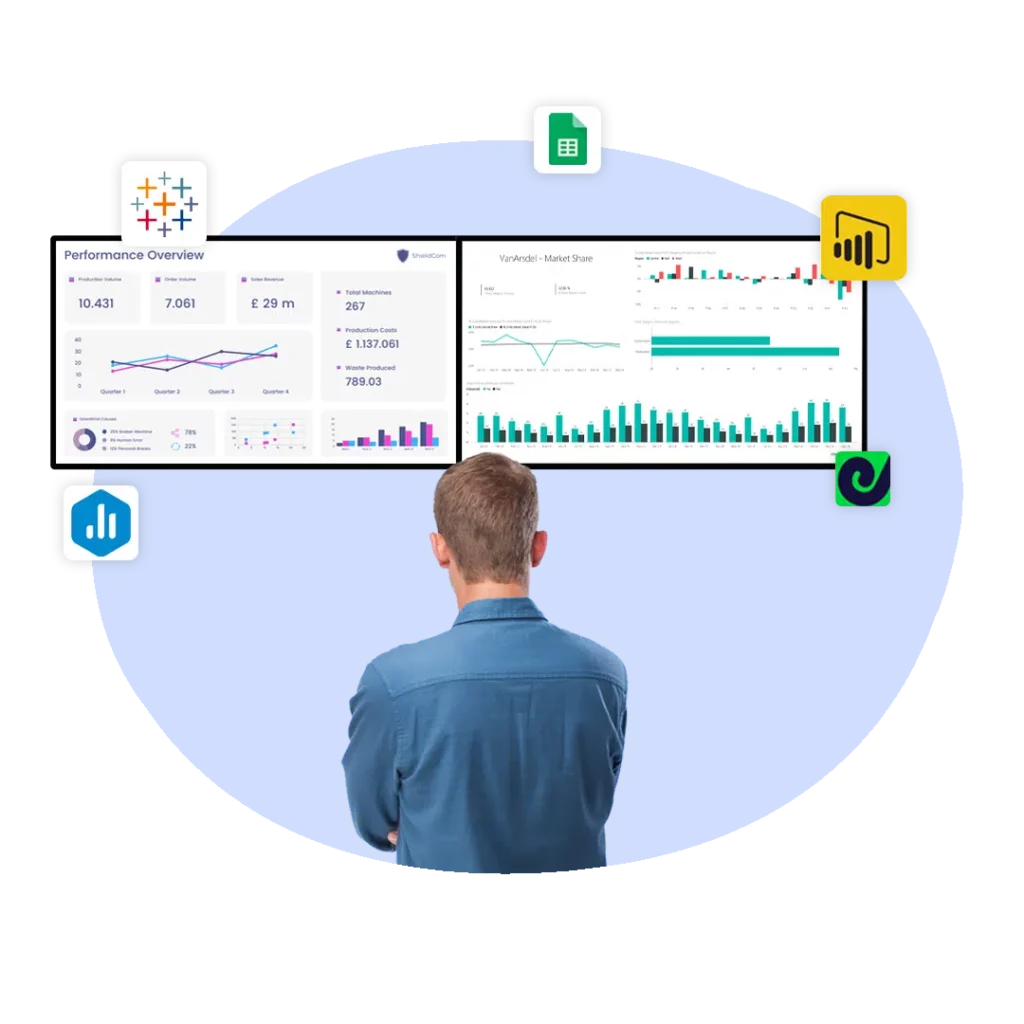
Alongside the native dashboard, it’s also possible to use third-party tools PowerBI and Tableau. Users are able to sign in to their account via the TrouDigital platform, select their dashboard and display it on their screens. Alternatively, they can display them via the webpage widget through a URL.
Users are able to grab the content from within the studio by selecting ‘data source’ under the dashboard widget, and choosing the preferred source. From here, it’s possible for you to track, analyse, and display data – either through an integration you already use, or through a custom CSV or spreadsheet. Doing so can help companies to visualise complex data, start engaging employees and boost production line performance.
If you have any further questions related to creating your manufacturing dashboard, reach out to our team of experts today.
